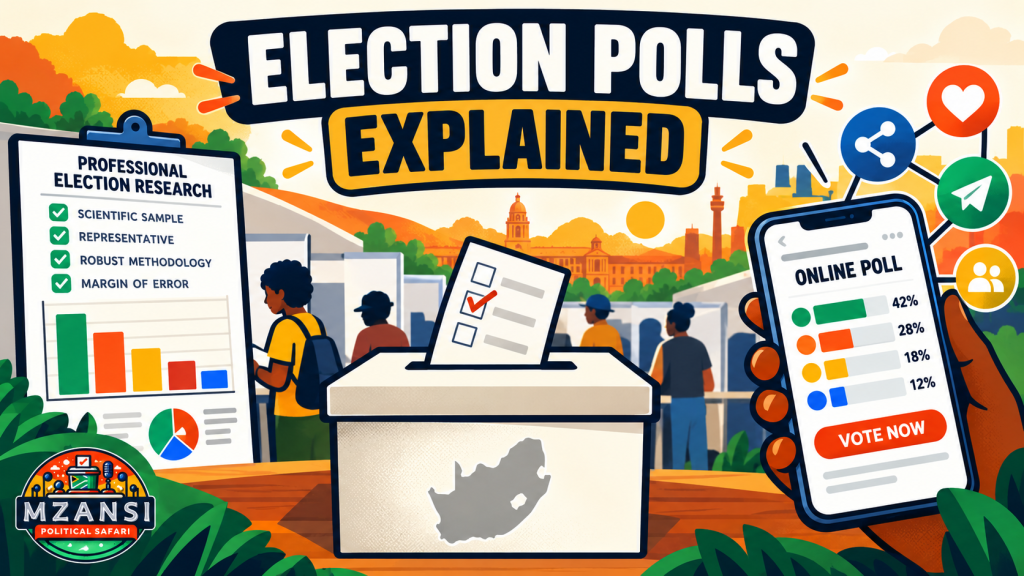
Election polls can provide useful information about voter sentiment, but not everything described as a “poll” measures the same thing. From professionally conducted surveys to open polls shared on X, Facebook or WhatsApp, understanding how participants were selected is essential before interpreting the percentages.
As elections approach, voters are likely to see an increasing number of polls showing levels of support for political parties, candidates and political issues.
Some are produced by professional research organisations using samples designed to represent a wider electorate. Others may be open polls on websites, X, Facebook, YouTube or other online platforms where anyone who encounters the question can participate.
Both can produce percentages, but, those percentages do not necessarily mean the same thing.
The most important question when assessing a poll is therefore not simply how many people participated, but how those people were selected and what population the poll is intended to represent.
What is an election poll?
An election poll attempts to measure political opinion among a defined group of people.
That could include all adults, people eligible to vote, registered voters or people researchers believe are likely to vote.
Instead of interviewing millions of voters, researchers select a smaller sample and use the responses to estimate opinion across the wider population.
A survey involving 1,000 or 2,000 carefully selected people can therefore provide useful information about a population containing millions of voters.
However, that depends heavily on how the sample was constructed.
How can a small sample represent millions of voters?
Survey research relies on the principle that a properly selected sample can provide information about a much larger population.
Consider a municipality with one million registered voters.
A researcher does not necessarily obtain a better measurement by asking the first 50,000 people willing to click on a publicly available online poll than by selecting 1,500 respondents using a method designed to represent voters across the municipality.
A large response count reduces some forms of statistical uncertainty, but it cannot by itself correct a sample that disproportionately represents particular groups.
Professional researchers therefore consider factors including geography, age, gender and other demographic characteristics when constructing and weighting samples.
Pew Research Center notes that the method used to recruit respondents is fundamental to understanding what conclusions can be drawn from an online survey.
Research polls and open polls are not the same thing
A poll appearing online can take several different forms.
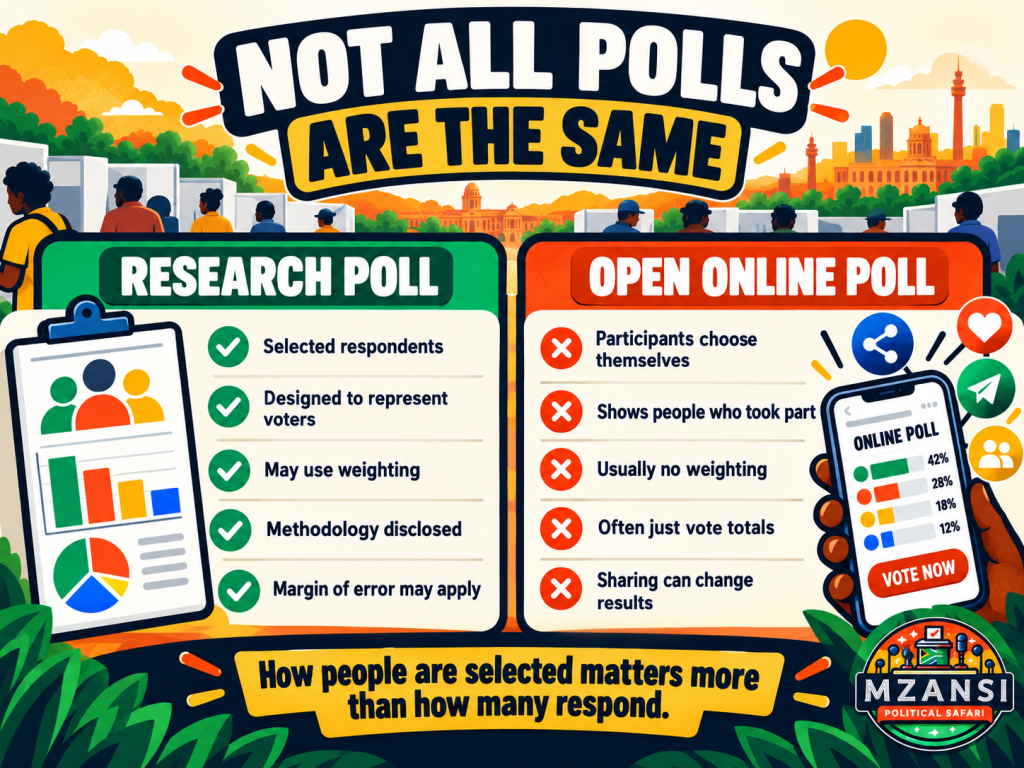
A professional research organisation may recruit respondents according to a defined sampling methodology and conduct the interviews face-to-face, by telephone or online.
A website or social-media account may instead post a question and allow anyone who sees it to participate.
These are different types of polling.
The distinction is not necessarily whether the poll is conducted online.
It is how participants entered the survey.
A research survey may attempt to estimate the views of registered South African voters.
An unrestricted online poll normally measures the responses of people who encountered the poll and decided to participate.
What is probability sampling?
In probability-based research, members of the population have a known or measurable chance of being selected for the survey.
Researchers may randomly select telephone numbers, addresses, geographic areas or individuals using a sampling framework.
Despite this, random selection does not guarantee a perfect poll.
Some selected people will refuse to participate, certain groups can still become underrepresented and other forms of survey error remain possible.
But probability sampling gives researchers a statistical basis for estimating sampling uncertainty and making inferences about the wider population.
What is a non-probability or opt-in research survey?
There is another category between traditional random sampling and a completely open social-media poll.
Professional researchers can use online panels or other groups of people who have agreed to participate in surveys.
Because those respondents were not necessarily randomly selected from the entire population, researchers may use quotas, screening, weighting, modelling and other statistical techniques to make the sample more closely resemble the population they want to study.
These are known as non-probability or opt-in samples.
They should not automatically be dismissed simply because respondents participate online.
However, they require careful methodology because the people who volunteer for surveys may differ from those who do not.
This is why a survey’s methodology is more informative than simply describing it as an “online poll”.
What is an open reader or social-media poll?
An open participation poll works differently.
A news website, organisation, individual or social-media account might ask:
“Which party would you vote for if an election were held tomorrow?”
Anyone who encounters the question may then select an answer.
Platforms such as X, Facebook and YouTube can be used to conduct these polls directly, while links to other online polls can circulate through WhatsApp, Telegram, Facebook groups, X posts and other online communities.
These polls can generate large numbers of responses, however, the participants generally selected themselves.
That means the result primarily describes the people who chose to participate, rather than necessarily representing registered voters as a whole.
Why can sharing change the result?
Open political polls are particularly susceptible to differences in who sees and shares them.
Suppose a poll initially receives 4,000 responses.
A supporter notices that their preferred party is performing poorly and shares the link to several or their WhatsApp groups, Facebook pages, Telegram channels or political networks.
Hundreds or thousands of like-minded supporters may then participate.
Another party’s supporters could subsequently do the same.
The percentages could therefore change substantially.
This does not necessarily mean anyone manipulated the poll or voted improperly. Each participant may have cast one vote and answered completely honestly.
The issue is selection bias.
People connected to networks where the poll is being circulated can become disproportionately represented, while voters who never see the link cannot participate at all.
Political enthusiasm can also affect participation
Supporters who are highly engaged with politics may be more likely to respond to an election poll than people who have weaker political preferences.
The followers of a particular political account may also differ considerably from the electorate as a whole.
The same applies to the audience of a particular Facebook page, YouTube channel, website or online community.
An open poll could therefore be a legitimate measurement of its participants, without being representative of South African voters generally.
This distinction is important when reporting the result.
If 46% of participants selected Party A, an accurate description would be:
“Party A received 46% of responses in the online poll.”
The same result would not by itself establish:
“Party A has 46% support among voters.”
The second statement makes a claim about a wider population that the open poll may not have been designed to measure.
Does a poll become reliable if enough people vote?
Not necessarily.
One of the most misleading features of open polling can be a very large response count.
Consider two surveys.
One involves 1,500 respondents selected using a methodology designed to represent registered voters.
Another attracts 50,000 responses through a publicly shareable online link.
The second survey has more than 30 times as many participants but that does not automatically make it more representative.
Pew Research tested online opt-in samples ranging from 2,000 to 8,000 respondents and found that increasing the sample size did very little to correct underlying bias. Larger samples produced greater statistical precision, but that precision could remain centred on a biased estimate.
In simple terms, adding more people from an unrepresentative group does not necessarily make that group representative.
Who participated can matter more than how many participated.
Does that mean all online polls are unreliable?
No.
A survey being conducted through the internet does not automatically make it unreliable.
Professional researchers can recruit respondents through probability-based methods and allow them to complete questionnaires online.
Others use established research panels combined with screening, quotas, weighting and statistical modelling.
An X poll available to anyone who sees a post is therefore fundamentally different from a professional survey that happens to use an online questionnaire.
The important question remains:
How did respondents get into the survey?
What is weighting?
Even a carefully constructed survey rarely matches the electorate perfectly.
Researchers therefore frequently apply statistical weighting.
Suppose younger registered voters account for 25% of the population being studied but only 18% of the completed interviews.
Researchers may give those respondents greater statistical weight.
If another group is overrepresented, its responses may receive slightly less weight.
Weighting can incorporate characteristics such as age, gender, geographic location, education, language or other variables depending on the survey and the population being measured.
The purpose is to bring the sample closer to known characteristics of the broader population.
Weighting is a normal component of modern polling.
It is not, however, capable of correcting every possible source of bias.
What is the margin of error?
Research polls frequently report a margin of error.
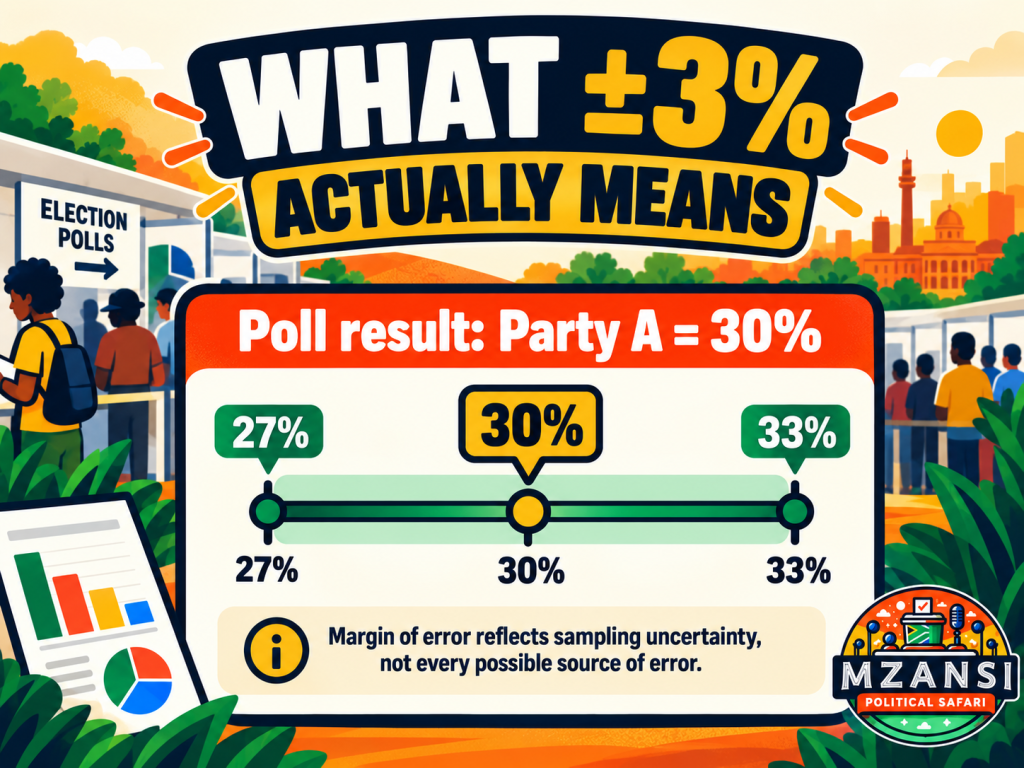
Suppose a survey measures support for a party at 30%, with a margin of error of ±3 percentage points.
A simplified interpretation is that the underlying level of support could fall within a range around that figure — roughly 27% to 33% under the statistical assumptions of the poll.
It does not mean there is a 3% chance the poll is wrong.
More importantly, the margin of error does not cover every possible source of polling error.
A poll can therefore finish outside its stated margin of error relative to the eventual election result without the margin-of-error calculation itself necessarily having been incorrectly calculated.
Why conventional margins of error can be misleading for open polls
Traditional margins of sampling error depend on assumptions about how respondents were selected.
Where anyone can volunteer by following an open link, those assumptions do not necessarily apply.
For an open online poll, the bigger problem may therefore not be whether the result is 30% ±2%.
The larger uncertainty is whether the people who participated resemble the electorate at all.
Why metro polls can be less precise than national polls
Sample size becomes particularly important when a national study is broken down geographically.
A national survey may include several thousand respondents, but only a fraction of them may live in a particular municipality.
The smaller metro sample generally carries greater statistical uncertainty.
Researchers can address this by deliberately conducting additional interviews in municipalities they want to measure.
This is why readers should look at the sample size and margin of error for the specific metro result, rather than assuming the national poll’s margin of error applies everywhere.
What does it mean when two parties are only a few points apart?
A small difference between two parties does not necessarily establish a clear difference in their underlying support.
Suppose Party A is measured at 31% and Party B at 29%.
The headline difference is two percentage points.
If the relevant margin of error is ±4 percentage points, there is considerable uncertainty around both estimates.
It would therefore be more accurate to report that the survey measured Party A at 31% and Party B at 29% than to treat the two-point difference as definitive proof of the state of the electorate.
This becomes particularly important in municipal polling, where sample sizes can be considerably smaller than national samples.
Registered voters and likely voters are not the same thing
Another important question is who the poll is measuring.
A survey of registered voters tells us what registered voters in its sample said.
But not every registered voter will participate in the election.
Researchers sometimes attempt to account for this by constructing a likely-voter or turnout model.
They may ask respondents how likely they are to vote, how interested they are in the election or use other measures of political participation.
Each respondent can then be assigned a different probability of turning out.
The results among all registered voters and the modelled group of likely voters can differ substantially.
Neither figure necessarily contains an error, as they are answering different questions.
Why turnout modelling matters in local elections
Turnout can have a considerable effect on election results.
Imagine that Party A is supported by 30% of registered voters in a survey while Party B is supported by 27%.
If a larger proportion of Party B’s supporters actually vote, Party B could perform differently among votes cast than the registered-voter poll initially suggested.
Pollsters therefore need to make assumptions about turnout when they attempt to model election-day behaviour.
Those assumptions can differ between researchers.
This is one reason two professional polls conducted during a similar period may produce different estimates.
How are South African researchers approaching the 2026 election?
Polling ahead of the 2026 Local Government Elections provides useful examples of different professional methodologies.
Ipsos interviewed 3,600 randomly selected South Africans between June and July 2026. Interviews were conducted in respondents’ homes and home languages, and the results were weighted to the population of South Africans aged 18 and older who were eligible to vote.
About 70% of respondents said they were registered voters, and Ipsos based its published voting-intention analysis on that group. Ipsos explicitly cautioned that its figures represented current sentiment rather than a prediction of the 4 November result.
A SABI Strategy Group local-election study conducted between 25 August and 17 September involved 5,001 registered voters, primarily interviewed face-to-face.
It included a national sample of 1,000 respondents and additional samples of approximately 1,000 voters in Johannesburg, Tshwane, Cape Town and eThekwini.
The survey used randomly drawn samples, statistical weighting and a model based on 52% turnout. The reported national margin of error was approximately ±3.2 percentage points, with similar margins for the four metro samples.
A separate Social Research Foundation survey carried out by Victory Research involved 2,214 registered voters between 8 and 31 July 2026.
Respondents were interviewed telephonically using computer-assisted telephone interviewing and random-digit dialling. The sample was weighted to registered-voter demographics and used a primary turnout model of 56%.
The reported national margin of error was ±2.1 percentage points, while samples of about 500 respondents in Johannesburg, Tshwane and eThekwini carried margins of ±4.4 points.
These are all professional research exercises, however, their methodologies, sample compositions and turnout assumptions differ.
That is one reason readers should not expect every reputable poll to produce exactly the same percentages.
Why can reputable research polls disagree?
There are several reasons professional surveys can produce different results even when conducted relatively close together.
Researchers may interview different samples, conduct their fieldwork on different dates, use face-to-face rather than telephone interviews, apply different weights or make different assumptions about which voters will actually participate.
Included in this, they may also handle undecided voters differently.
Ordinary sampling variation can cause further differences to results.
A disagreement between two polls therefore does not automatically mean one is reliable and the other is not.
We first need to look at their methodologies before a conclusion can be reached.
The fieldwork dates matter
The date on which a poll is published can also be misleading if readers do not check when the interviews actually took place.
A survey released this week may contain responses collected several weeks earlier.
Events occurring after the fieldwork ended could not have influenced those answers, but may affect future sentiments of the same candidates used in the poll.
This is particularly important during an election campaign, when candidate announcements, political events, service-delivery developments and campaign activity may affect voter sentiment.
When comparing polls, the fieldwork period can therefore be more useful than the publication date.
Is a poll a prediction of the election result?
Usually not.
An opinion poll primarily tells us what its respondents said during a particular period.
A forecast tries to estimate what will happen in the future.
Those are different exercises.
A research poll might accurately describe public opinion on the day respondents were interviewed and still differ from the final election result several weeks later because people change their minds or because turnout differs from expectations.
Professional researchers frequently describe election polls as snapshots of opinion rather than predictions. Ipsos has made this distinction explicitly in its 2026 local-election research.
How accurate have South African election polls been?
Past elections demonstrate both the usefulness and the limitations of polling.
Ahead of the 2024 national election, Ipsos research conducted between March and April measured the ANC at 40.2% and the DA at 21.9%.
The Electoral Commission’s final national ballot results were 40.18% for the ANC and 21.81% for the DA.
Those estimates were extremely close.
The same Ipsos survey, however, measured MK at 8.4% and the EFF at 11.5%. The final national ballot produced 14.58% for MK and 9.52% for the EFF.
A Social Research Foundation tracking poll conducted much closer to election day measured the ANC at 42.2%, the DA at 21.6%, MK at 12.4% and the EFF at 10.8%.
The examples show why describing an entire poll simply as “right” or “wrong” can obscure important differences.
A poll may closely estimate some parties while missing movement elsewhere.
The timing of fieldwork, turnout and changes in voter preference can all affect the comparison with the final result.
Why comparing several polls can be more useful than following one
An individual survey contains normal statistical variation.
Looking at several credible polls over time can provide a clearer view of whether voter opinion appears to be moving consistently in one direction.
For example, if one survey shows a party gaining four percentage points, the change could partly reflect sampling variation.
If several independent surveys using different methods begin showing a similar movement, the evidence of a broader trend becomes stronger.
Where do X and Facebook polls fit?
Polls run directly on X, Facebook or other social-media platforms can be useful for measuring audience participation.
They can show how followers or users who encountered a particular post responded.
They can also demonstrate which issues motivate people to engage.
What they generally cannot establish by themselves is the level of support for a party among all registered voters.
The audience may already lean toward particular political views, the platform’s algorithm determines who sees the poll, and users can share it into communities that are disproportionately supportive of one option.
The number appearing next to an option therefore represents the votes cast in that particular poll, not automatically a measurement of South Africa’s electorate.
What about polls shared through WhatsApp?
The same issue applies when an open poll link circulates through WhatsApp.
The people receiving the link are not randomly selected from the electorate.
A link could spread rapidly through one party’s supporter groups while barely appearing in another party’s networks.
Thousands of genuine individual responses could therefore still result in an unrepresentative sample.
The problem is not necessarily the validity of each response, but the way the group of respondents was assembled.
Can open online polls still be useful?
Yes, provided their limitations are clearly stated.
An open reader or social-media poll can tell us how participating users answered a question.
It can provide insight into audience engagement and reactions among particular online communities.
It may also identify issues that generate unusually high interest.
What it cannot automatically do is convert those respondents into a representative sample of the electorate.
Reporting should therefore distinguish between support among poll participants and estimated support among voters.
How should you assess a poll?
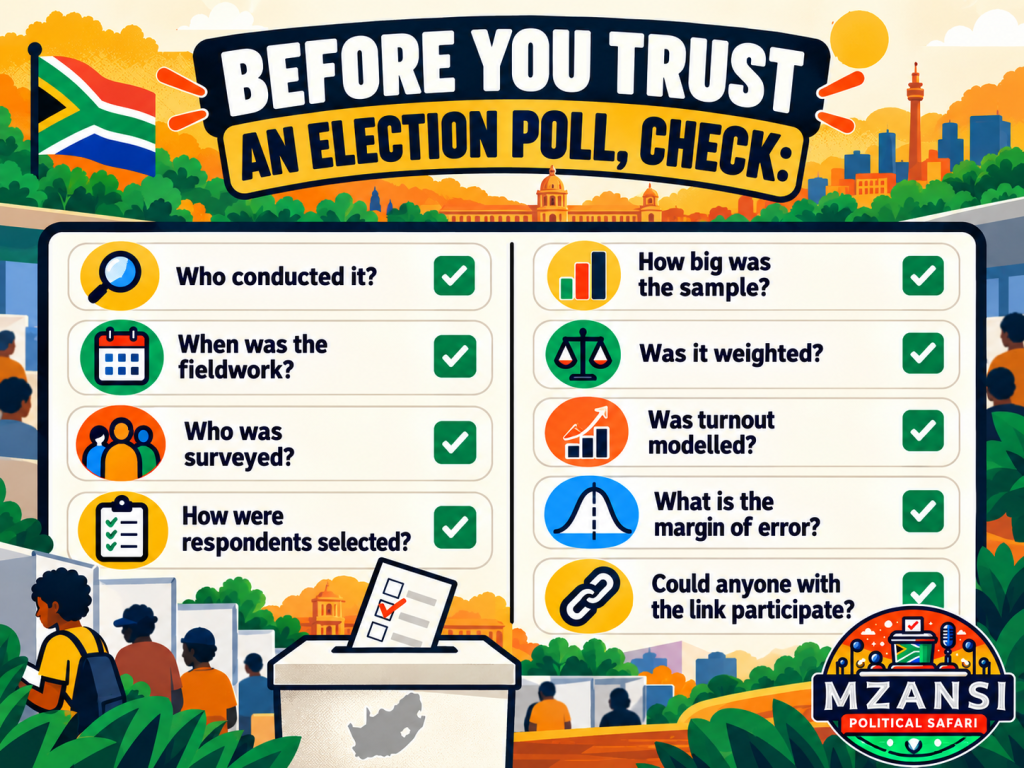
Before placing too much weight on an election poll, readers should look for the following information:
- Who conducted the research and who commissioned it?
- When was the fieldwork conducted?
- Who was eligible to participate — adults, eligible voters, registered voters or likely voters?
- How were respondents selected?
- How large was the sample, including any provincial or metro subsamples?
- Was the sample weighted, and how?
- Was a turnout or likely-voter model used?
- What margin of error or other measure of uncertainty was reported?
- How were undecided respondents treated?
- Was participation restricted to a research sample, or could anyone with a link take part?
No single answer proves that a poll is accurate.
Together, however, these details provide considerably more information than the headline percentages alone.
The bottom line
Election polls can provide valuable information about voter sentiment, but the word “poll” covers several very different types of surveys.
Professional research polls attempt to use sampling, weighting and other statistical methods to estimate the views of a wider population.
Non-probability research can also use sophisticated methods to produce useful estimates, although the way participants are recruited and adjusted remains important.
Open reader and social-media polls measure something different.
They can accurately record what participating users selected, but they are vulnerable to self-selection, audience differences and organised sharing because respondents were not necessarily selected to represent the electorate.
That is why an online poll with 50,000 responses is not automatically more informative about South African voters than a professionally constructed survey involving 1,500 people.
A headline percentage is only the end result.
To understand what it actually means, the more important question is:
How were the people behind that percentage selected?